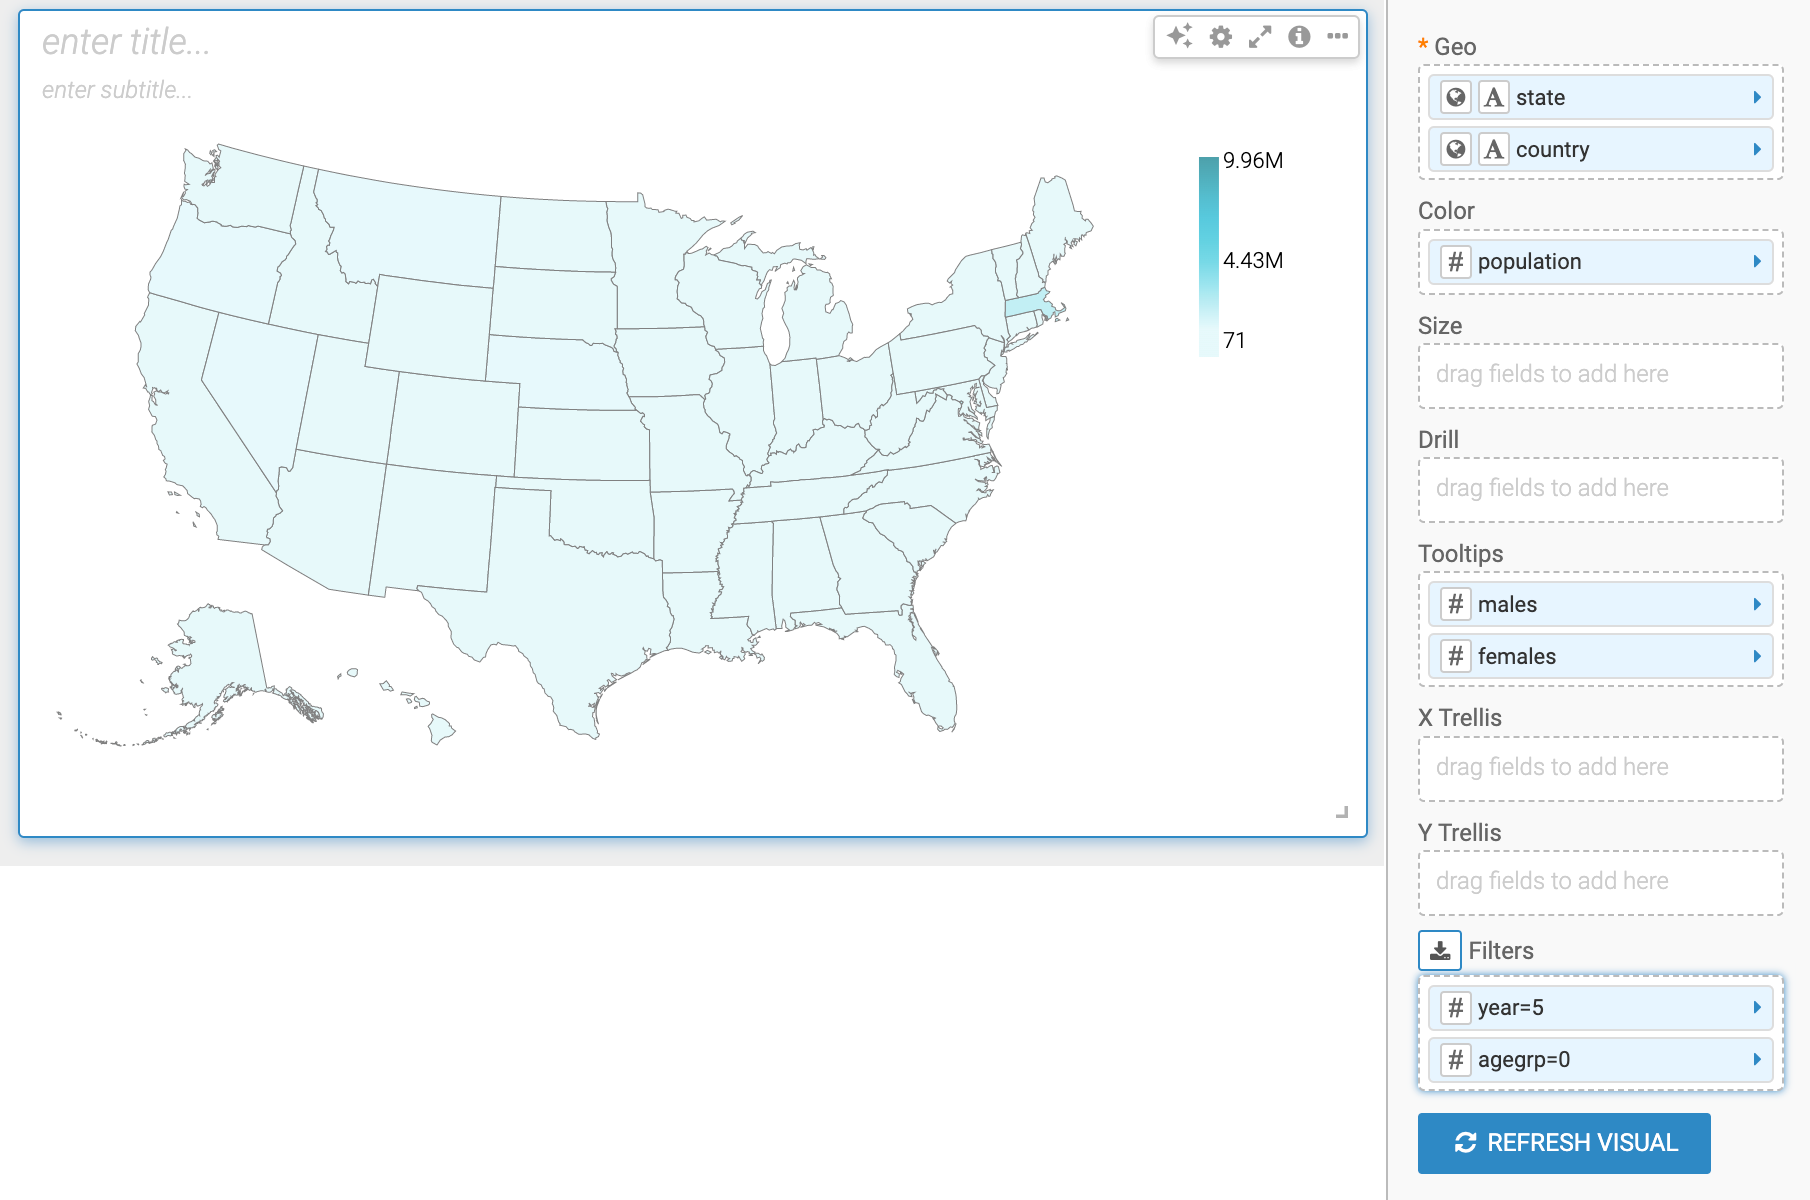
The specifics for the sample visual follow:
- Dataset:
US County Population
- Visual type: map
- Geo shelf:
stname field, aliased as state, and
ctyname field, aliased as country
- Color shelf: add
tot_pop field, then
change the expression to sum([tot_pop]) as 'population'
- Tooltips shelf: add
tot_male field and
change the expression to sum([tot_male]) as 'males', and add
tot_female field and change the expression to
sum([tot_female]) as 'females'
- On the Color and Tooltips shelves,
change the Display Format for each field by adding the comma
thousands separator.
- Filters shelf: for the
year field, change
the expression to year=5, and for the agegrp
field, change the expression to agegrp=0